Big Data
Ask any engineer involved in motorsport about the real strength of a data acquisition system and they will say it is not the data itself but the quality of the analysis of the information logged. Whether you use a budget machine or one that can accept up to 1000 channels of high-speed data doesn’t make any difference; the real challenge is to understand what is being recorded and how to use that information to change the car, ultimately to make it go faster.
At the simplest level, the main channels on any data logger are likely to be engine speed and throttle angle. To understand how the power unit works in conjunction with the chassis, inputs such as steering and lateral acceleration are also a must. Using these five channels and not having to understand anything else about the engine, a driver can generate more than enough data to improve his driving skills by comparing data lap after lap. Indeed, some kind of chart-overlaying feature is the first stage in any data analysis process, and is the one most commonly used, while a popular add-on feature these days is the ability to synchronise video data files to those logged directly from the engine controller.
As power unit engineers, however, we are much more interested in engine control, so in addition to the above recorded channels we might wish to include a number of pressures (oil, fuel and so on), a smattering of temperatures (coolant, intake air, oil and exhaust gas, say), injector pulse widths, lambda (a function of air-to-fuel ratio) and ignition timing. Logging all these against time for a typical 15-minute club race will generate far more data than many engineers or drivers can ordinarily handle, so some simple way of analysing the data has to be found. Fortunately, even the simplest data logger has a number of ways in which it can assist.
To start with what is generally the default setting, multiple channels can be plotted against the time or distance travelled. This enables the driver or engineer to pinpoint certain events during the lap and read off other parameters happening at the same time.
Many analysis software packages can also generate histograms or sometimes more usefully x-y plots. In the latter case, one channel can be plotted against another to infer whether there is any causal relationship between the two. One example of this is a plot of gallery oil or fuel pressure against the lateral g-force when a slight fall-off in the pressure on right- or left-hand corners could indicate the presence of oil or fuel surge.
A particularly useful feature in many systems is the ‘maths’ channel. By using the data measured on one channel, a new function can be computed to help our understanding. A good example of this, and one that is highly topical in Formula One, is the subject of fuel consumption. By using our knowledge of the pulse width applied to the fuel injector, along with fuel pressure and temperature, we can determine the amount of fuel going into the engine per injection pulse and, summed over a unit of time, the rate of fuel consumption can be calculated. Summed over the whole race, the total fuel consumed can be derived. How accurate this is compared to, say, a fuel flow meter is open to debate, but the whole idea of maths channels increases the flexibility and potential usefulness of any system.
As powertrains become more complex, the need for data logging and subsequent analysis of the data can only increase.
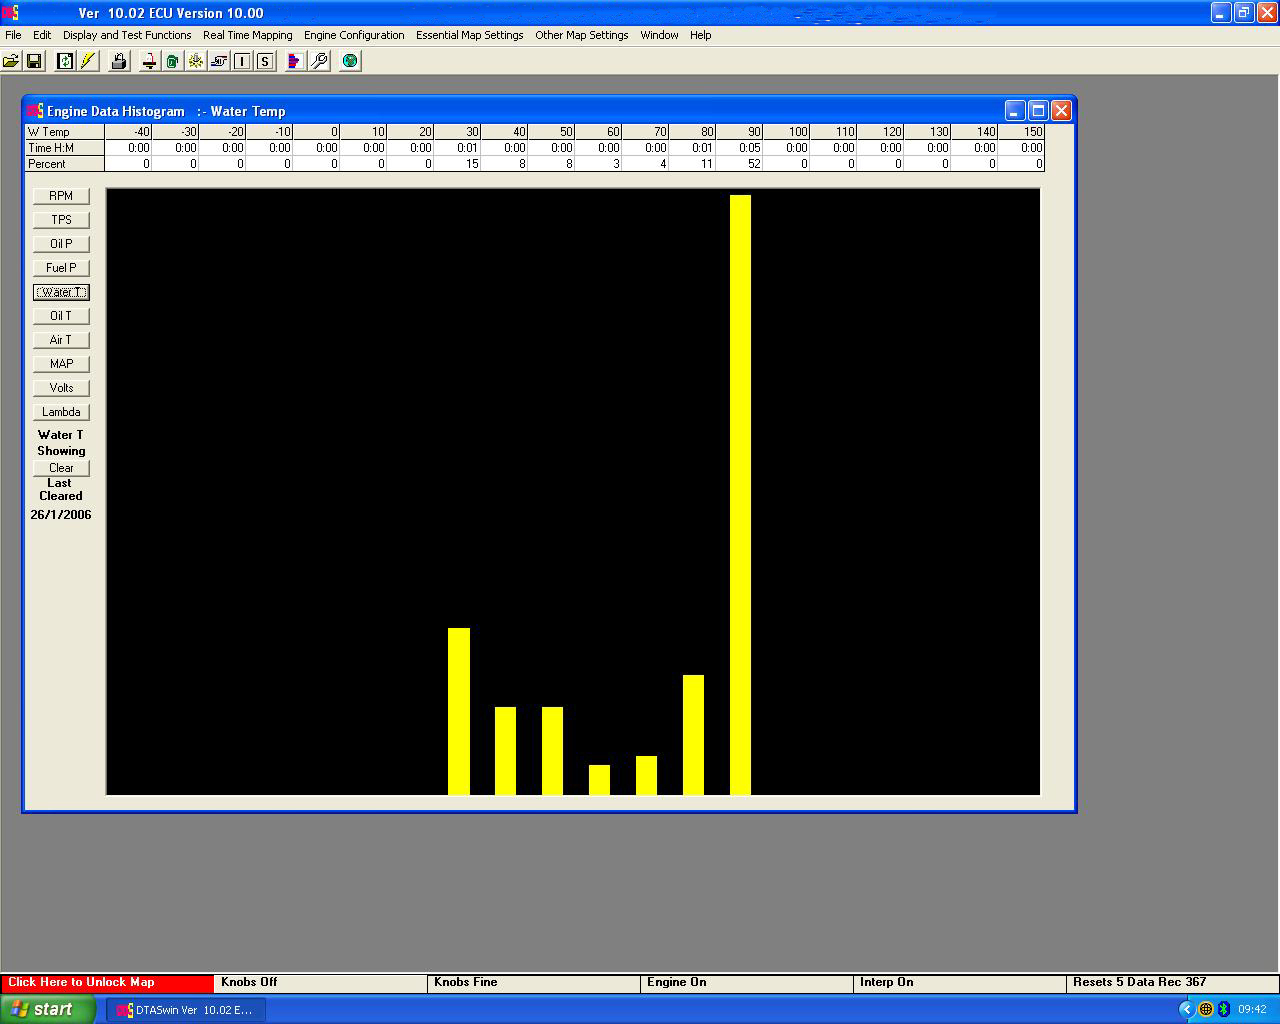 Fig. 1 - A simple histogram, summarising coolant outlet temperature
Written by John Coxon