Combustion analysis
In high-performance race engines, understanding the processes taking place during each combustion cycle is of great importance to development, be it with the intention of gaining more power, reliability or efficiency. Being able to measure and then analyse the combustion process effectively is a vital tool in allowing engineers to optimise an engine's design.
It is often thought that this sort of analysis is the preserve of manufacturers building clean-sheet engine designs, but the benefits of combustion analysis make it relevant even to small-scale race engine builders and tuners. The number of parameters that can be investigated given the equipment available on the open market is legion, although for the purposes of this article we will look at just one of the most useful, the pressure-volume (PV) loop. The reason is twofold - it provides a very clear graphical representation of a cylinder's behaviour, and any changes or corrections made to an engine are immediately visible.
Equipment
The production of a PV loop for an engine requires at least one pressure sensor per cylinder, a means of accurately recording crank position, and computing resources to gather and present the recorded data. For purely experimental engines, pressure sensors can be built into the cylinder head architecture, but a far more practical approach is the use of spark plug sensors. These are specially designed plugs that incorporate a high-speed piezoelectric pressure sensor that can record the pressures generated in the cylinder.
There are several companies producing such sensors, which come with features such as 'flame guards' to reduce errors produced by thermal shock experienced during the combustion process. Crank position can be measured using an engine's built-in sensors, but these generally lack resolution so specialised sensors are preferable. Most companies specialising in such test equipment will normally be able to supply an integrated data acquisition system complete with plug-and-play interfaces for sensors and dedicated software to process the large volume of data generated.
The PV loop
A PV loop is a line graph that displays in-cylinder pressure at all points in a particular cylinder's cycle. This simple graphical representation provides an invaluable insight into the combustion behaviour of an engine as the cylinder volume changes with the crank stroke. This representation also allows for very easy comparison of different engine configurations.
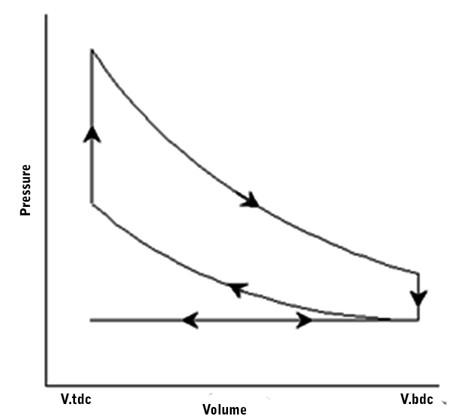
Fig. 1 - The PV loop representing the ideal Otto Cycle
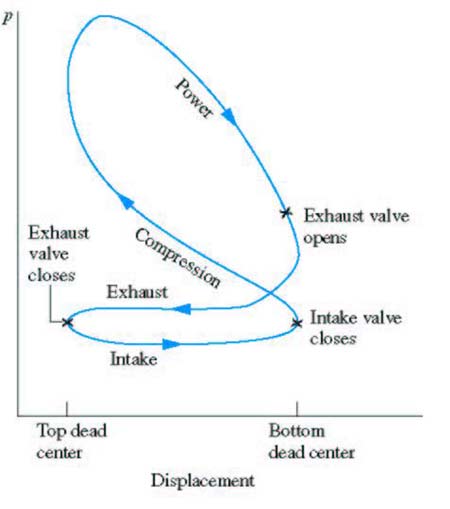
Fig. 2 - A typical PV loop for a spark-ignition engine
Fig. 1 shows the ideal PV diagram for an Otto cycle engine, while Fig. 2 shows the PV diagram for a typical combustion engine, with the key events annotated. It can be seen from the comparison of the two diagrams that the ideal cycle has no pumping loop (grey shading). This indicates that the gas exchanges from the intake manifold into the cylinder, and from the cylinder into the exhaust manifold after combustion, should ideally occur without any associated losses. In practice, this can never be realised, and work is always expended drawing air into the cylinder and expelling exhaust gas from the cylinder.
The work output of an internal combustion engine is indicated by the difference in area contained within the power loop and the pumping loop. This means that improvements in an engine's efficiency can be identified by an increase in the size of the power loop relative to the pumping loop. In simple terms, if the combustion efficiency of the engine is increased, this will be represented as a greater area within the power loop, with no change in the pumping loop.
However, useable power can also be gained by reducing pumping losses, which can be identified by a reduction in the area of the pumping loop while the power loop remains constant. With an engine instrumented to record this information, the effects of changes to factors such as valve events, ignition timing and inlet/exhaust design can be compared very easily.
Producing PV graphs for individual cylinders also allows each cylinder to be compared with the others, and treated as an individual engine, the goal being to make all cylinders as efficient as possible. This is the key benefit of combustion analysis: where a dyno allows you to look at only the overall output of an engine, individual cylinder analysis gives a far more complete picture of an engine's performance.
In future instalments of RET-Monitor we will look at the individual areas of the PV graph in more detail and relate them to potential performance gains, as well as address some of the other aspects of combustion analysis.

Fig. 3 - The pumping section of PV graph for a six-cylinder engine. Each line represents the pressure trace for a separate cylinder. Note the variation between the values for each cylinder
Written by Lawrence Butcher