Particle image velocimetry
It is vital for any Formula One team wanting to remain competitive to maximise its research and testing resources. Whether it is because of financial limitations, regulatory constraints or a simple lack of hours in the day, there is never as much testing data available as they would like. To this end, teams are constantly assessing new technologies and methodologies that could help draw more data from a given testing scenario.
One such development in the sphere of aerodynamics testing has been the appearance of PIV (particle image velocimetry), a process that allows engineers to gain an accurate visualisation of flow characteristics and velocities over a vehicle or component. In the past, the only way to physically visualise the flow over a part was to use either a smoke wand or coat the component in a dye that would highlight flow lines, but neither of these provided a particularly detailed picture of the flow interactions at the all-important surface-air interface. Flow can also be visualised in a CFD (computational fluid dynamics) simulation, but it has been difficult to ascertain whether the results are accurate. PIV is therefore a very useful tool, allowing for simulated results to be validated and new insights gained into flow characteristics.
The process involves filling a wind tunnel with a mist of tracer particles that have essentially the same density as air, meaning that the flow conditions will be as close as possible to those found on track. When the tunnel is running, the particles flow with the air stream through the test section. For a PIV test, engineers position a camera at 90º to the plane of the flow field they want to study, and the part to be studied is illuminated with a high-power laser, creating a 2D plane of light.
A series of two-set photos is then taken at extremely rapid intervals – generally 10-20 µs – which are then processed using powerful software to track the position change of each particle in the cross-section, allowing for the rate and direction of flow to be calculated. The resulting image looks very similar to those generated in CFD, but instead of being created from simulated data it is a representation of the actual flow velocity over a part.
The result is that PIV now provides engineers with the ability to carry out accurate checks on CFD predictions on flow velocity in the real world, allowing for the CFD models to be refined for greater accuracy. An example of this is the Toyota Formula One team’s efforts during the 2009 season to understand the flow generated by a car’s wheels. The team had run CFD simulations of the flow but PIV allowed them to test the accuracy of these results. The use of the new technique was very revealing, and showed that the CFD simulated results were considerably underestimating the size of the wake generated by the wheels. Once this was discovered, the engineers were able to adjust the CFD parameters to negate the discrepancy, giving them greater confidence in subsequent CFD test results.
The other major benefit of PIV is that it does not interfere with other wind tunnel testing procedures. With wind tunnel use regulated, this represents a considerable benefit, increasing the data yield from a particular test run.
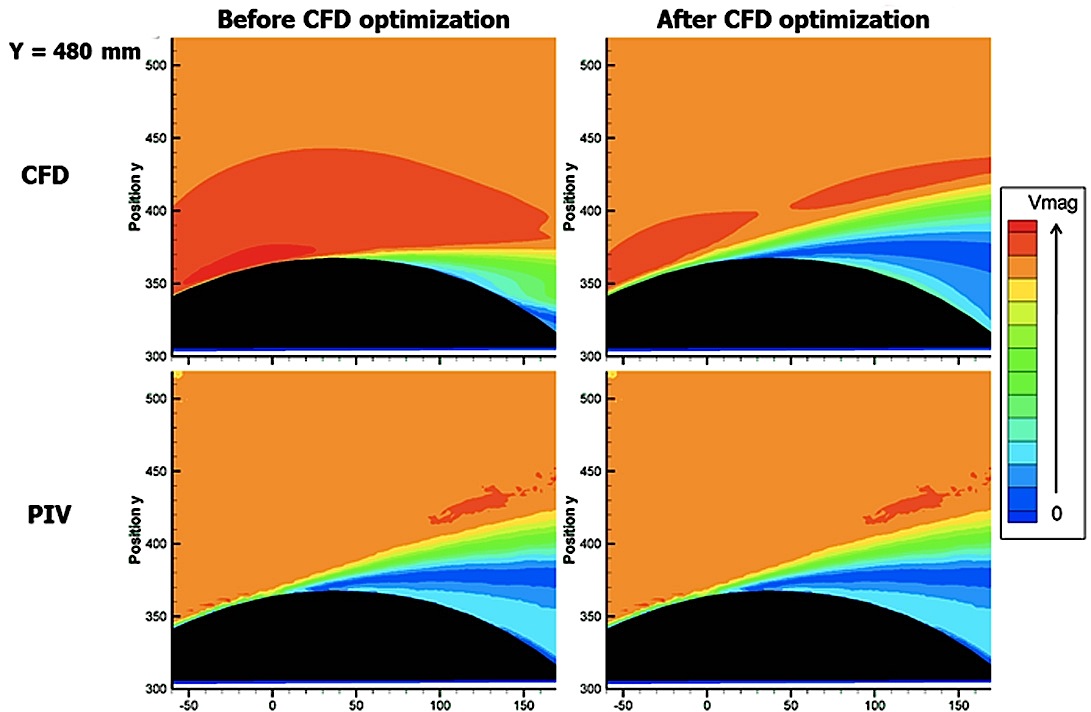
Fig. 1 - A comparison of PIV and CFD plots showing the wake off a front wheel. The results on the right show the increase in correlation between results generated in the wind tunnel and CFD following optimisation of the CFD programming (Courtesy of Toyota Motorsport)
Written by Lawrence Butcher
3218