Using tractive effort curves to analyse gearing
 In the last edition of Monitor we introduced the concept of 'Tractive Effort' curves plotted against road speed to analyse performance.
Most 'racers' are familiar with using the traditional straight line plot of road speed against engine rpm as a method of choosing ratios. Whilst this gives an indication of maximum speed in each gear and helps to assess the drop in engine rpm associated with changing up into the next ratio, its use is otherwise limited. In particular it does not
introduce any engine parameters into the equation, and so the estimate that we have of rpm drop is only as good as the driver's intuitive feel for how well the engine performs in this rpm range.
The tractive effort curves, which quantify applied motive force at the ground, include all of this information and more, and so they can tell us how well our ratios are suited to the engine's characteristics as well as the fundamental track parameters that have driven their choice.
We noted in Part 1 that engine power will rise to a peak before starting to fall again. This invariably occurs before we reach the engine's 'safe' rpm limit and the temptation is to make full use of this. But depending upon the rate of fall off in power after the peak is reached, this may not always be the right thing to do.
We can see this in the tractive effort curves. The torque curve from which they are derived is in itself related to the power curve by the equation P=n.T (P=power; n=rpm; T=Torque). If the power were to remain constant, an increase in rpm would see a fall in torque, so when power falls torque drops off more steeply. The tractive effort curve develops a negative slope which increases. We can see that if the engine is taken to maximum rpm we can reach a point at which we are making less tractive effort in that gear than if we had selected the next one. In other words we would be accelerating faster in the higher gear once past the point where the curves cross over.
If we also include the aerodynamic and mechanical drag force curves on the same diagram then the point at which the tractive effort curve(s) cross will represent our theoretical top speed. This does not have to be in our highest ratio gear, and in an 'overdrive' transmission it will not be.
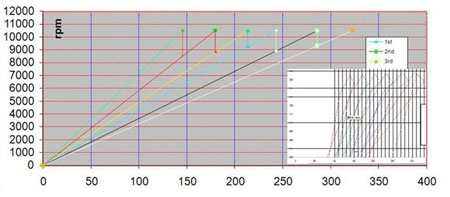
Although we tend to think of engine performance in terms of 'power output' it is much easier to analyse it 'on track' using these torque derived curves. However, we can also plot curves of power in each gear against road speed. A set of these are shown in the lower corner of the ratio chart. We can clearly see the effect of the fall in power after peak power rpm is reached and how the power developed at the same road speed in consecutive gears can overlap.
The area which lies below the tractive effort curves in our graph is the product of Forces and Velocities and is therefore measured in units of power. The key to optimising the power of the engine throughout the speed range of the track in question is to maximise this area. If we reach maximum rpm in a gear before crossing the next T.E. curve then we must add a vertical boundary to the set of curves which will intersect this curve. If we cross over the tractive effort curve for the next gear by remaining in gear until maximum rpm, then we are cutting out a small, roughly triangular shaped section of the available area every time that we do so, which represents wasted power.
We can see that we can draw a curve that will run from top left top to bottom right on the graph and which is tangential to each tractive effort curve. This is the curve we would obtain if we had an infinite number of gear ratios, instead of the discreet number shown. In other words it represents the power exploited if we had a continuously variable transmission system (CVT). The equation of this curve would be P=k.V.
The use of these curves is not limited to the choice of gearing. They can be useful in mapping an engine, and in many ways are a key element in bringing together the sometimes conflicting requirements of the engine designer and the chassis designer.
Fig. 1 - Comparison between conventional ratio chart and power/speed based chart
Written by Peter Elleray
5310